
Asian Americans, Native Hawaiians, and Pacific Islanders (AAPI) are among the fastest-growing racial demographic cohorts in the United States. With over 24 million individuals (including mixed-race) spread across the nation, this burgeoning population has emerged as the nation’s fastest-growing voter bloc. The unprecedented turnout rates witnessed in the 2020 presidential election and 2022 midterm elections underscore the increasing political influence of AAPI voters, often surpassing the margin of victory in key battleground areas.
To address the rapid growth and impact of AAPI communities, state-specific AAPI voter demographic fact sheets are regularly updated every two years. These comprehensive resources offer essential insights into AAPI population metrics and voter engagement indicators tailored to all 50 states and the District of Columbia.
Designed for political campaigns, elected representatives, advocacy organizations, media entities, and academic researchers, these AAPI voter demographic state fact sheets provide invaluable insights. They empower stakeholders to comprehend and strategically engage with the AAPI electorate in their respective states, fostering informed decision-making and inclusive civic participation. See reports below.
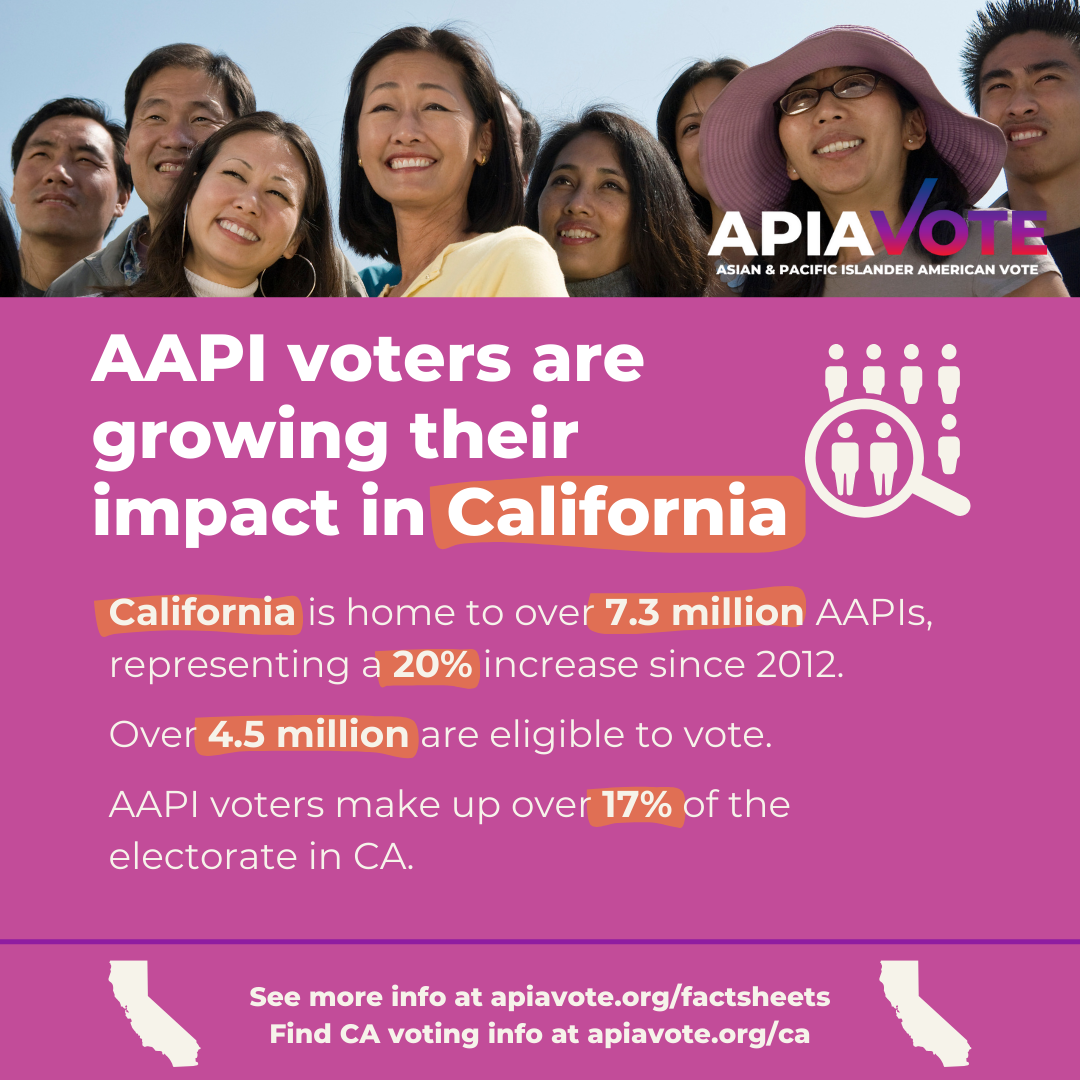
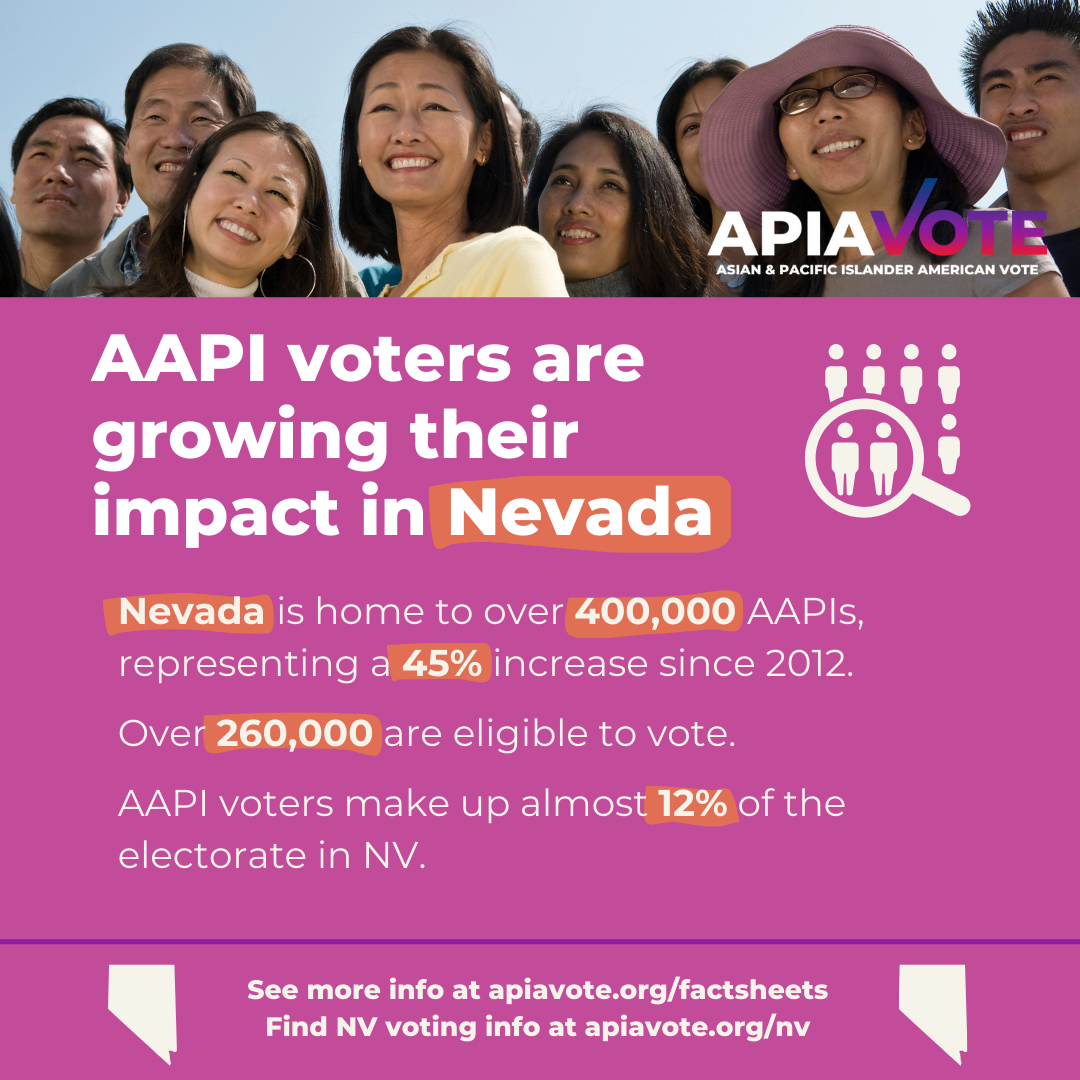
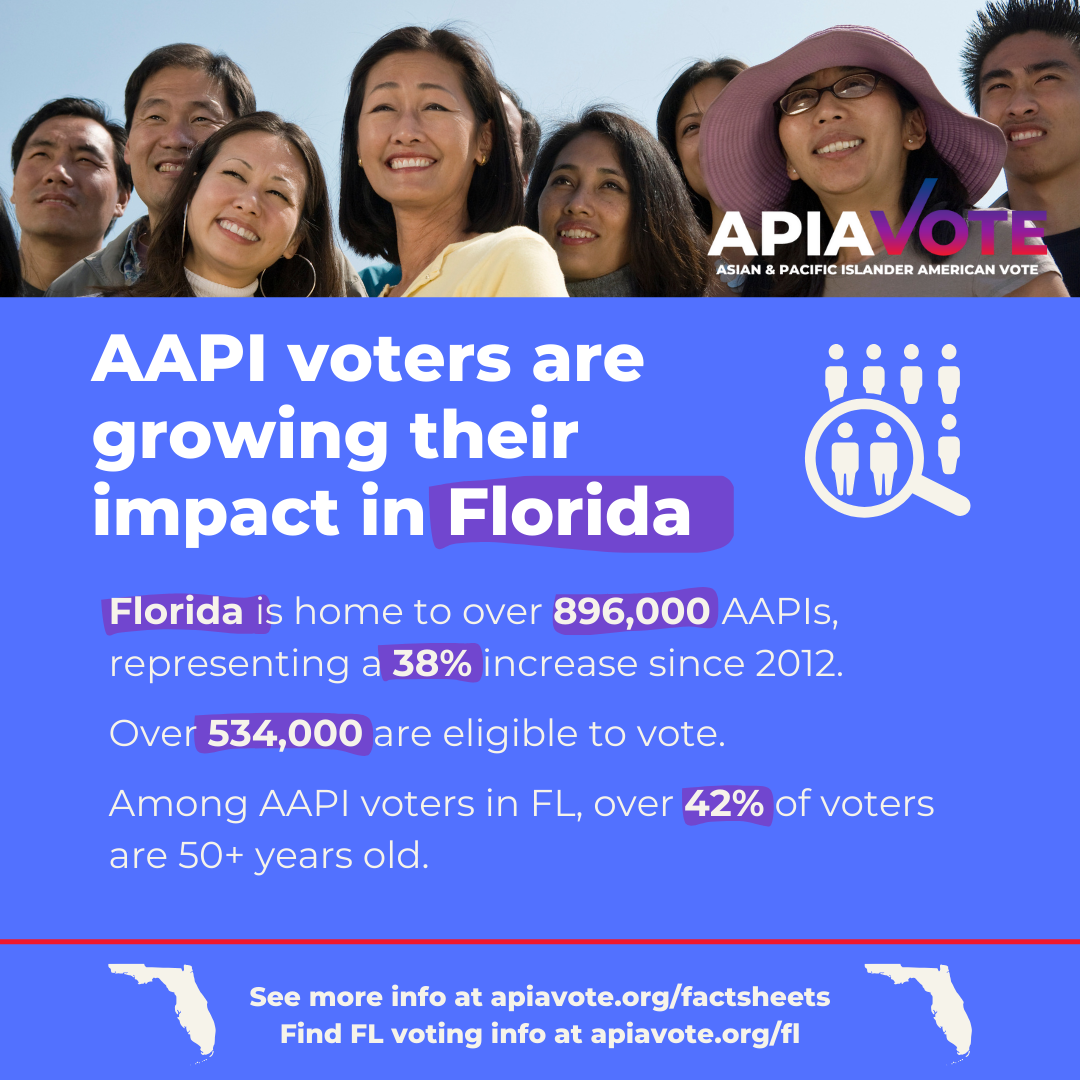
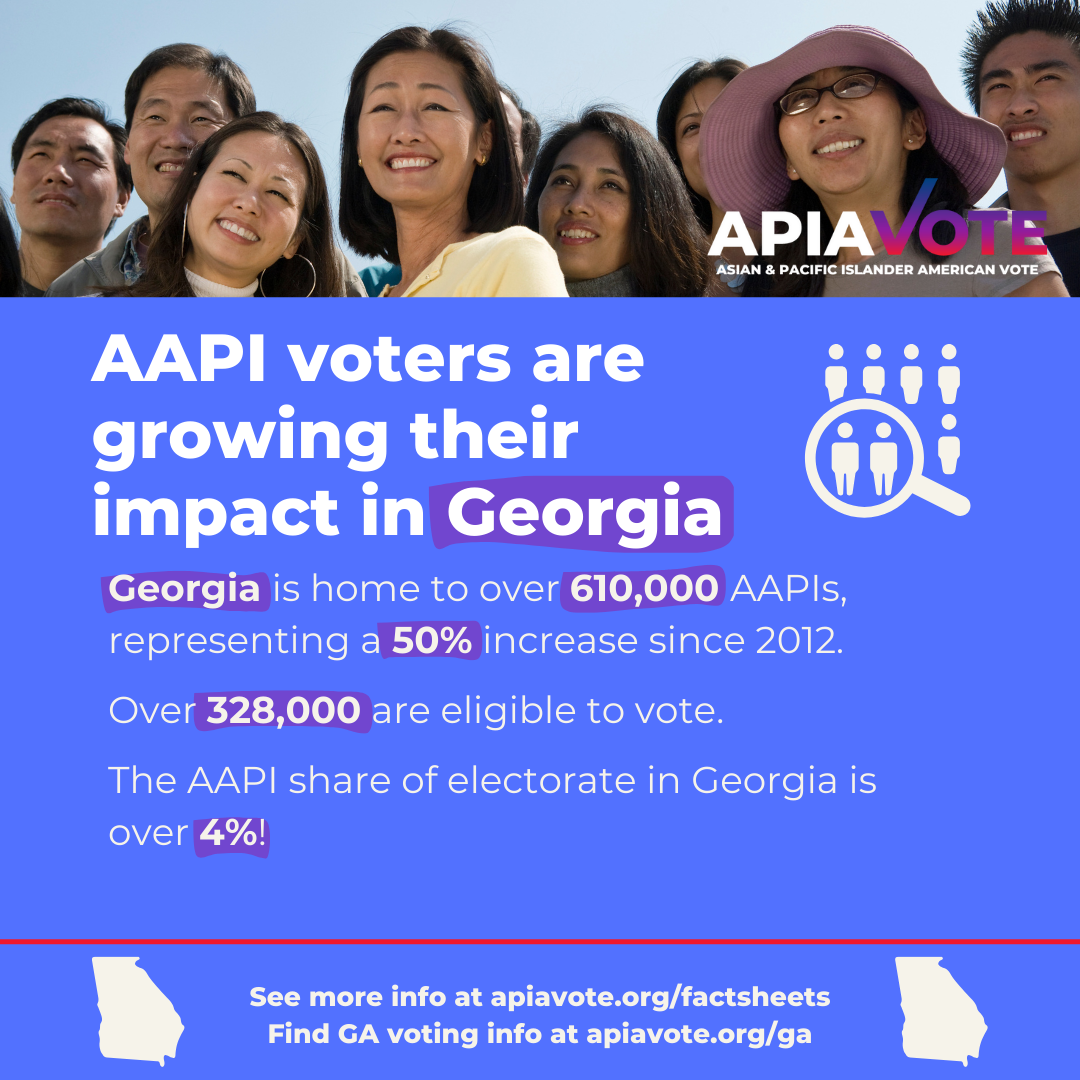
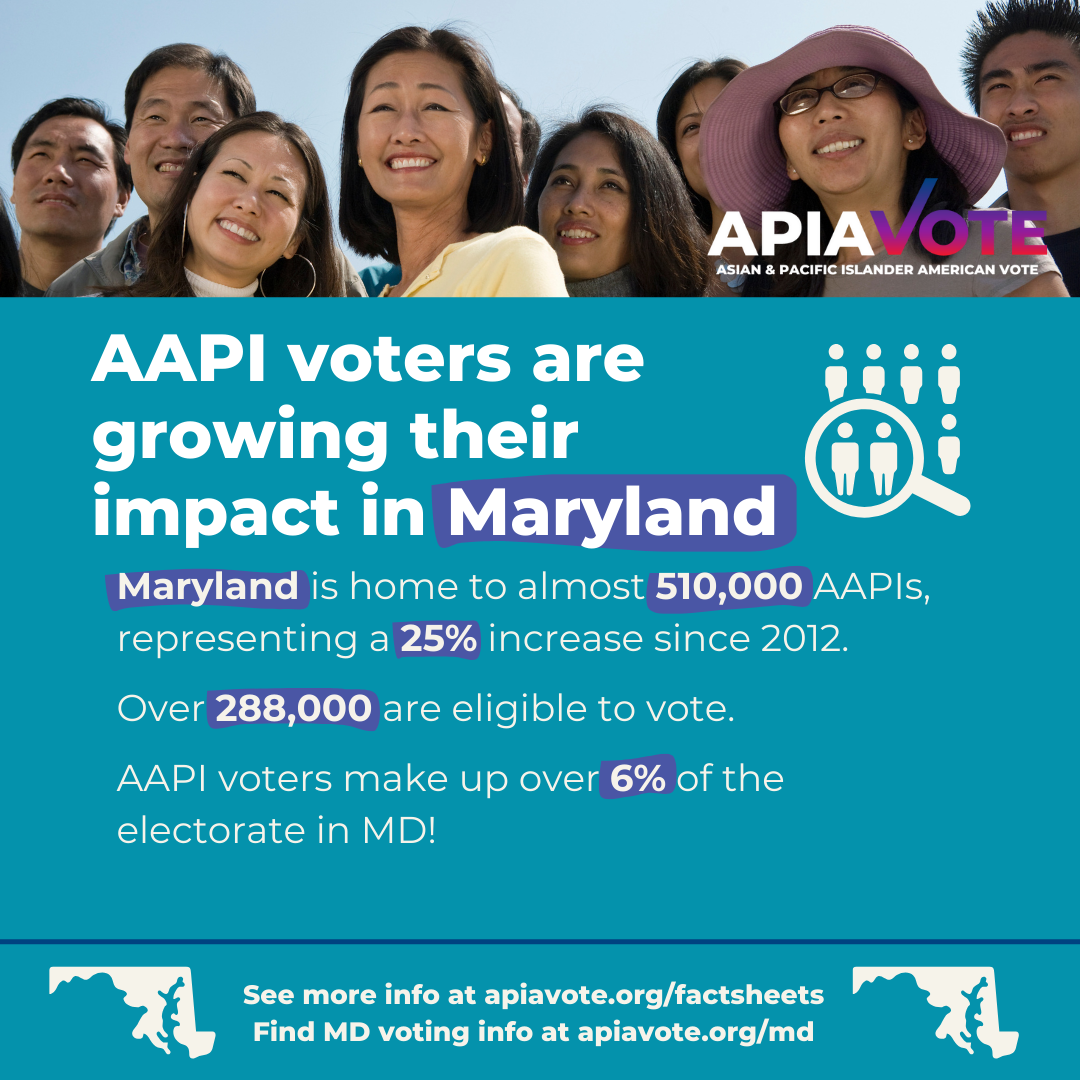
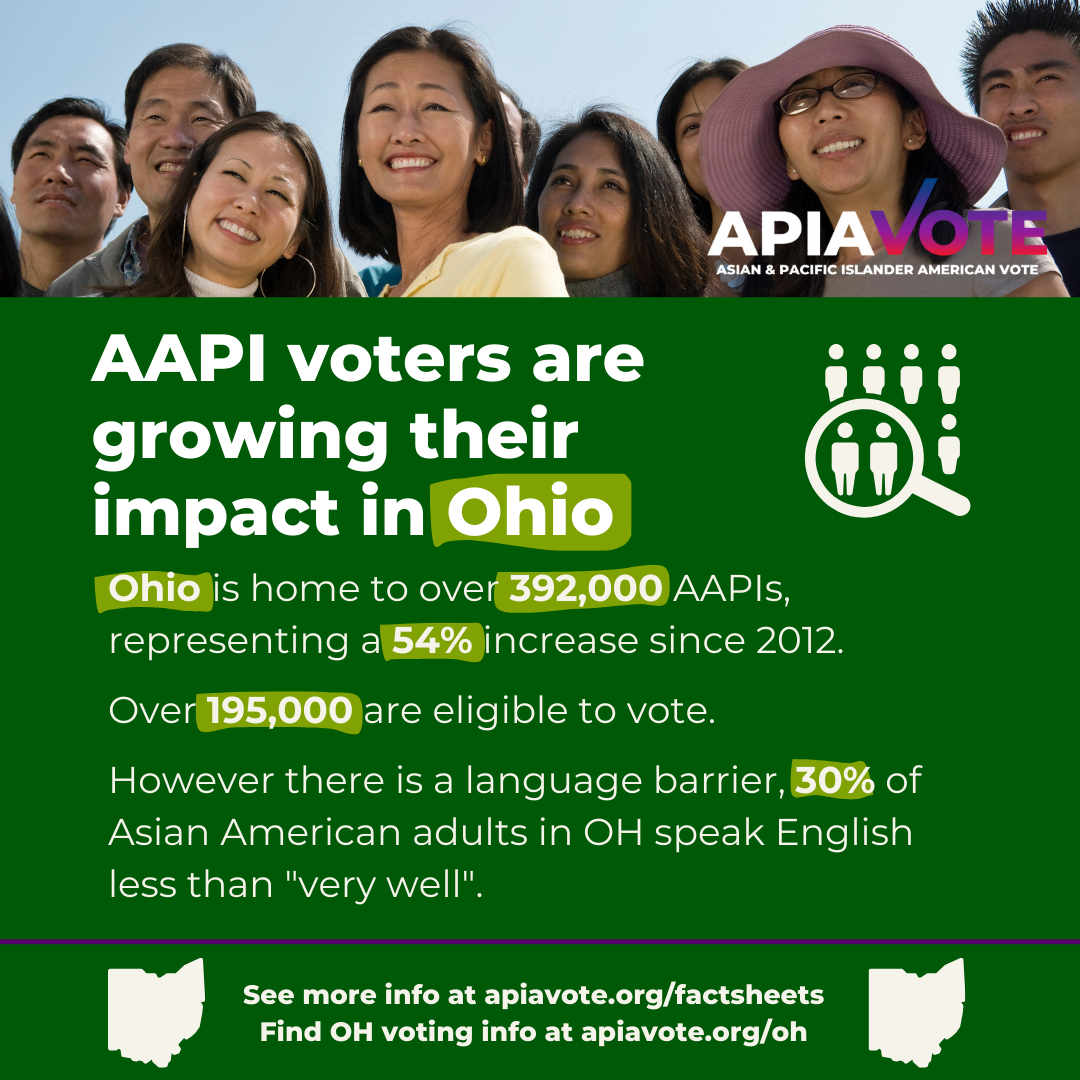
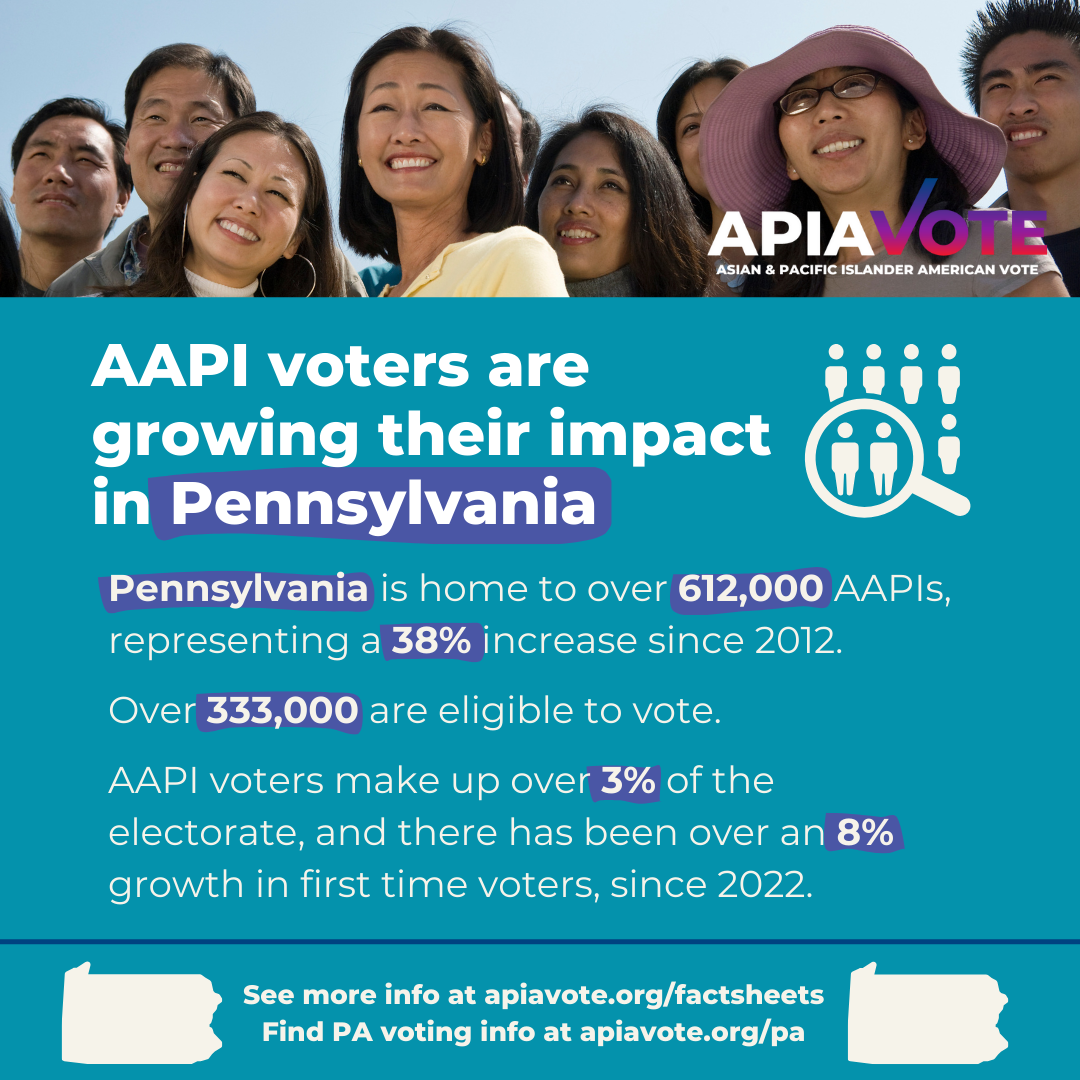
The AAPI community has witnessed remarkable population growth between 2012-2022, especially in states where the AAPI voting bloc holds significant influence with a vote share of 4% or higher. Notable examples include:
While the AAPI population is spread nationwide, certain counties have emerged as hubs with significantly higher AAPI concentrations. These include:
A considerable portion of the AAPI population is foreign-born, with many states reporting over 50% of AAPI residents speaking languages other than English at home. Limited English proficiency is also a notable challenge, impacting access to opportunities and services.
Poverty and lack of health insurance coverage are persistent issues for some segments of the AAPI community. Certain states have higher rates of AAPI poverty and uninsured residents, highlighting the need for targeted support and resources.
These insights shed light on the dynamic growth of the AAPI community across states with substantial voting power, as well as the geographic concentration in specific counties, underscoring the increasing influence of this diverse population segment.
*click above link for combined fact sheets
Alabama · Alaska · Arizona · Arkansas · California · Colorado · Connecticut · Delaware · Florida · Georgia · Hawaii · Idaho · Illinois · Indiana · Iowa · Kansas · Kentucky · Louisiana · Maine · Maryland · Massachusetts · Michigan · Minnesota · Mississippi · Missouri · Montana · Nebraska · Nevada · New Hampshire · New Jersey · New Mexico · New York · North Carolina · North Dakota · Ohio · Oklahoma · Oregon · Pennsylvania · Rhode Island · South Carolina · South Dakota · Tennessee · Texas · Utah · Vermont · Virginia · Washington · West Virginia · Wisconsin · Wyoming
Alabama · Alaska · Arizona · Arkansas · California · Colorado · Connecticut · Delaware · Florida · Georgia · Hawaii · Idaho · Illinois · Indiana · Iowa · Kansas · Kentucky · Louisiana · Maine · Maryland · Massachusetts · Michigan · Minnesota · Mississippi · Missouri · Montana · Nebraska · Nevada · New Hampshire · New Jersey · New Mexico · New York · North Carolina · North Dakota · Ohio · Oklahoma · Oregon · Pennsylvania · Rhode Island · South Carolina · South Dakota · Tennessee · Texas · Utah · Vermont · Virginia · Washington · West Virginia · Wisconsin · Wyoming
Arkansas · Arizona · California · Colorado · Florida · Georgia · Hawaii · Illinois · Iowa · Louisiana · Massachusetts · Michigan · Minnesota · Missouri · New Jersey · New York · Nevada · North Carolina · Ohio · Oregon · Pennsylvania · Texas · Utah · Virginia · Washington · Wisconsin
Arkansas · Arizona · California · Colorado · Florida · Georgia · Hawaii · Illinois · Iowa · Louisiana · Massachusetts · Michigan · Minnesota · Missouri · New Jersey · New York · Nevada · North Carolina · Ohio · Oregon · Pennsylvania · Rhode Island · Texas · Utah · Virginia · Washington · Wisconsin
Arizona · California · Florida · Hawaii · Illinois · Louisiana · Massachusetts · Michigan · Minnesota · New Jersey · New York · Nevada · North Carolina · Ohio · Oregon · Pennsylvania · Texas · Virginia · Washington
Asian and Pacific Islander American Vote (APIAVote) is the nation’s leading nonpartisan nonprofit dedicated to engaging, educating, and empowering Asian American and Pacific Islander (AAPI) communities to strengthen their voices and create impact. For over 15 years, APIAVote has been at the forefront of a rising movement to ensure AAPIs are represented and heard, leading to historic voter turnout and advancing equity for AAPI communities.
© 2022 APIAVote. All rights reserved. Policies and Accessibility.
APIAVote is a public charity recognized as tax-exempt by the IRS under Section 501(c)(3). All donations are tax deductible to the extent allowed by law.